RISW 2026 Methodological Debrief & Strategic Synthesis
This debrief compiles, contextualizes, and cites core presentations, short courses, and agency discussions from the 2026 Regulatory-Industry Statistics Workshop (RISW)1–10. It is curated to invite cross-functional review, critical dialogue, and thoughtful methodological considerations for biostatisticians, clinical pharmacologists, data scientists, and regulatory strategists evaluating the prospective integration of Artificial Intelligence (AI) and Machine Learning (ML) within their own therapeutic development pipelines.
Please note: Given the wide breadth of emerging agency policies, algorithmic tools, and statistical designs presented across the workshop, this article provides a comprehensive, high-level overview and is intentionally extensive. Detailed, dedicated deep dives into selected methodological topics are planned for separate future releases.
The convergence of Artificial Intelligence, Machine Learning, and large-scale computational modeling across the pharmaceutical lifecycle represents an inferential paradigm shift. Rather than treating AI as an exploratory exercise for target discovery or conversational drafting, regulatory agencies and quantitative leaders have begun formalizing frameworks to deploy high-capacity algorithms into confirmatory clinical trials, regulatory review pipelines, and post-market safety surveillance.
This debrief synthesizes the methodological advances from the 2026 Regulatory-Industry Statistics Workshop (RISW) alongside the evolving governance architecture established by the US FDA (CDER/CBER/CDRH AI frameworks, Digital Health Center of Excellence)11–14, the European Medicines Agency (EMA) (Reflection Paper on the Use of Artificial Intelligence in the Medicinal Product Lifecycle)15, and the International Council for Harmonisation (ICH M15, draft ICH E20, and ICH E9(R1))16–18.
═════════════════════════════════════════════════════════════════════════════════════════════════
                       THE REGULATORY AI / BIOSTATISTICS ECOSYSTEM
═════════════════════════════════════════════════════════════════════════════════════════════════

  1. REGULATORY SCIENTIFIC GOVERNANCE (FDA Agentic Pilot, EMA AI Reflection, ICH M15 / E20)
  ├── FDA December 2025 Agentic Deployment: Internal CDISC audit & CSR discrepancy detection
  ├── ICH M15 Credibility Matrix: Model Influence vs. Consequence of Decision Error → MAP
  └── ICH E20 Simulation Standard: Simulations as formal regulatory evidence (≥100k runs)

  2. GENERATIVE & AGENTIC AI IN BIOSTATISTICAL & REGULATORY WORKFLOWS (PS04, PS49, PS43, SC08)
  ├── Agency-Level Implementation: FDA internal review agent pilots & Sentinel surveillance
  ├── Industry Benchmarking & Operational Reality: DISRUPT-DS consortia findings
  ├── Statistical Evaluation Frameworks for Generative AI & SaMD:
  │   ├── Regulatory Considerations for Agentic Language Models as SaMD (Gene Pennello)
  │   └── Illustrative Example: Modern Statistical Design via Bayesian Ordinal Models (Sheraz Khan)
  └── Additional Information: Academic Exploratory Toolkits & Proofs-of-Concept (SC08)

  3. FOUNDATION MODELS & CAUSAL INFERENCE IN CONFIRMATORY RCTS (SC01, PS43)
  ├── The Prediction vs. Inference Tension: Why raw ML estimators fail confirmatory standards
  ├── The Methodological Solution: AI-Assisted Covariate Adjustment (Ting Ye)
  └── Mathematical Backbone & Statistical Guarantees (Type I error invariance & efficiency)

  4. IN SILICO TRIALS, DIGITAL TWINS & FEDERATED RWE (PS41)
  ├── Virtual Representations in Clinical Development: Showcase of Emerging Concepts
  ├── In Silico Control Cohorts in Organ Impairment: Innovative Computational Frameworks
  └── The "XYZ" Unified Framework: An Innovative Use Case in Evolving Regulatory Thinkings

  5. AI-ASSISTED ADAPTIVE TRIAL DESIGNS AND AGENT HUBS (SC04, Plenary 1, PS37)
  ├── Covariate-Adaptive (CAR) & Response-Adaptive (CARA) Randomization: AI-Assisted Short Course
  ├── AI Agent Hubs in Early-Phase Optimization: Advantages, Results, and Parameter Risks
  └── The Bridge to Draft ICH E20: Clinical Trial Simulation as Formal Regulatory Evidence

  6. METHODOLOGICAL RISKS, TRAPS & THE QUANTITATIVE COMPETENCY ROADMAP
  ├── Three Critical AI Methodological Traps: Incoherence, Unadjusted Testing, Anchor Illusion
  └── Professional Roadmap: Four AI Competencies for Biostatisticians as a Grounded Example

  7. STRATEGIC SYNTHESIS: FRAMEWORK MAPPING ACROSS DEVELOPMENT PHASES
═════════════════════════════════════════════════════════════════════════════════════════════════
1. The Global Regulatory Governance Landscape
Health authorities are shifting away from general high-level principles toward risk-stratified, audit-ready evidentiary standards for computational models and AI pipelines.
                      GLOBAL REGULATORY GOVERNANCE MATRIX
┌───────────────────────────────────────────────────────────────────────────────────────────────┐
│ US FDA (CDER / CBER / CDRH)                                                                   │
│ • Internal Agentic Review (Dec 2025): Autonomous agents for CDISC verification & CSR auditing │
│ • Discussion Papers & Guidance: Context of Use (CoU), data provenance, bias mitigation        │
│ • Digital Health Center of Excellence (DHCoE): Regulatory science for SaMD & digital twins    │
├───────────────────────────────────────────────────────────────────────────────────────────────┤
│ EUROPEAN MEDICINES AGENCY (EMA)                                                               │
│ • Reflection Paper on AI in the Medicinal Product Lifecycle (EMA/CHMP/CVMP/83833/2023)        │
│ • Core Tenet: "Human-in-the-loop," algorithmic explainability, and lifecycle risk monitoring  │
│ • Proposition: Ultimate responsibility for data integrity and clinical inference lies on sponsor│
├───────────────────────────────────────────────────────────────────────────────────────────────┤
│ INTERNATIONAL COUNCIL FOR HARMONISATION (ICH)                                                 │
│ • ICH M15 (MIDD, Step 4): Risk classification (Model Influence vs. Consequence of Error)      │
│ • Draft ICH E20 (Adaptive Designs): Simulation dossiers as formal regulatory submissions      │
│ • ICH E9(R1): Estimand preservation across AI-assisted adjustments and synthetic cohorts      │
└───────────────────────────────────────────────────────────────────────────────────────────────┘
Operationalizing ICH M15 for AI and Machine Learning (PS07)
Historically applied to pharmacometrics and physiologically-based pharmacokinetic (PBPK) modeling, ICH M15 (General Principles for Model-Informed Drug Development [MIDD])16 has expanded into a governance standard for biostatistical machine learning, synthetic control arms, and predictive AI models (Tobias Mielke, Million Tegenge, Alison Margolskee, Nicky Best)4.
- The Credibility Risk Matrix: Model credibility requirements scale proportionally across two dimensions16:
- Model Influence: The degree to which the model drives the regulatory decision (Low, Medium, High).
- Consequence of Incorrect Decision: The public health and patient safety risk if the model reaches a false conclusion (Low, Medium, High).
- The "Critical Risk" Mandate: When an AI algorithm or in silico model directly supports confirmatory efficacy (High Influence) for marketing authorization (High Consequence), it enters the Critical Risk Tier16. Sponsors cannot rely on post-hoc justification; they must prospectively submit an audit-ready Model Analysis Plan (MAP) prior to study unblinding.
- Required MAP Specifications:
- Precise articulation of the Context of Use (CoU) and the statistical Question of Interest (QoI).
- Detailed data provenance, curation protocols, and verification of underlying data distributions.
- Pre-specified sensitivity analyses and hard congruence windows: quantitative boundaries that trigger model decoupling or reversion to an unadjusted analysis if empirical trial data diverge beyond tolerance.
2. Generative and Agentic AI in Biostatistical & Regulatory Workflows
The adoption of generative and agentic AI in pharmaceutical biostatistics is shifting from informal productivity aids to formal, auditable workflows governed by health authority expectations. Rather than static conversational interfaces, regulatory agencies and industry consortia are focusing on multi-agent architectures capable of autonomous task decomposition, code generation, and verification5, 8.
                         REGULATORY & INDUSTRY AGENTIC WORKFLOW
┌─────────────────────────┐       ┌─────────────────────────┐       ┌─────────────────────────┐
│ Regulatory Submission   │       │ Supervisory Controller  │       │ Specialized Tool Agents │
│ • eCTD Module 5 (CSRs)  │ ───▶  │ • Decomposes audit tasks│ ───▶  │ • CDISC SDTM/ADaM parser│
│ • define.xml & datasets │       │ • Routes verification   │       │ • SAS / R code executor │
└─────────────────────────┘       └─────────────────────────┘       └─────────────────────────┘
                                                                                 │
                                                                                 ▼
┌─────────────────────────┐       ┌─────────────────────────┐       ┌─────────────────────────┐
│ Reviewer Deliberation   │ ◀───  │ Discrepancy Matrix      │ ◀───  │ Independent Execution   │
│ Human-in-the-loop expert│       │ Flags narrative vs. data│       │ Re-runs primary model to│
│ evaluation & judgment   │       │ mismatches automatically│       │ confirm table numbers   │
└─────────────────────────┘       └─────────────────────────┘       └─────────────────────────┘
Agency-Level Implementation: FDA’s Internal Agentic Review Deployment (PS04, PS43)
The deployment of agentic AI systems within the FDA (December 2025) marks an operational turning point in regulatory data auditing and submission inspection5:
- Automated CDISC Verification: As presented by agency statisticians (Laura Thompson, FDA CDRH), internal review agents ingest study data packages (SDTM, ADaM), parse
define.xmlmetadata, verify variable derivation logic, and automatically generate independent, executable SAS and R verification scripts5. This enables automated re-calculation of primary and secondary efficacy endpoints directly from submitted analysis datasets. - Cross-Module Discrepancy Auditing: Regulatory agents cross-reference text narratives in Clinical Study Reports (CSR Module 5) against summary clinical efficacy tables (Module 2.7.3) and patient-level dataset rows, systematically identifying internal numerical discrepancies that previously required manual auditing5.
- Post-Market Surveillance (FDA Sentinel System, PS43): At the post-marketing stage, agency projects evaluated generative AI prompts to draft standardized protocol synopses for active surveillance within Sentinel’s Active Risk Identification and Analysis (ARIA) system, accelerating safety signal follow-up while maintaining protocol consistency (Jamal Jones, FDA)7.
Industry Benchmarking & Operational Reality (PS04, PS49)
- DISRUPT-DS Industry Roundtable (Justine Rochon, Takeda, PS04): Drawing on benchmarking across 14 major pharmaceutical sponsors, industry data science leaders confirmed that sponsor organizations are transitioning from isolated chat tools to autonomous agents embedded in analysis pipelines5. With the FDA deploying automated cross-checking tools, sponsors must institute internal "mirror review" agents to pre-screen eCTD filings, ensuring that data definitions, derivation programs, and narrative summaries are reconciled before submission.
- Academic Survey of Biostatistical Workflows (Steven Grambow, Duke, PS49): Cross-sectional survey data of biostatisticians documented rapid adoption of LLMs for statistical programming, reporting, and evidence synthesis, but identified high error rates and verification difficulties8. This survey underscored the operational reality of moving beyond unstructured interfaces into enterprise platforms with formal data boundaries, organizational governance, and verification guardrails.
Statistical Evaluation Frameworks for Generative AI and SaMD (PS43, PS49)
Traditional natural language processing (NLP) metrics (such as BLEU or ROUGE) evaluate surface-level n-gram overlap, failing to assess clinical validity, output reproducibility, or patient safety in regulated environments. Evaluating dynamic AI systems requires establishing formal regulatory principles for medical software alongside robust statistical testing frameworks.
Regulatory Considerations for Agentic Language Models as SaMD (Gene Pennello, FDA CDRH, PS49)
As outlined by agency statisticians, the emergence of Agentic AI (AAI) language models as Software as a Medical Device (SaMD) represents a structural shift from static, user-prompted language models to autonomous systems where specialized agents interact dynamically to execute multi-step clinical workflows8.
Because these systems exhibit autonomy, non-determinism, and algorithmic opacity, regulatory evaluation must expand beyond standard static software validation8:
- Dual Evaluation of Performance and Clinical Benefit: Regulatory science requires distinct statistical frameworks to evaluate both device performance (e.g., technical accuracy, output reproducibility across repeated executions) and clinical benefit (direct or indirect effects on patient outcomes and clinical decision quality).
- Quantifying Non-Determinism and Uncertainty: Sponsors must measure output variability by testing identical clinical inputs across varied random seeds to quantify stochastic entropy.
- Embedded Risk Mitigation: To mitigate clinical risk, agentic architectures should incorporate specialized sub-agents dedicated to verifying input data veracity and explicitly quantifying the uncertainty of the device’s recommendations before outputs reach clinicians or patients.
Illustrative Example: Modern Statistical Design and Analytical Evaluation via Bayesian Ordinal Models (Sheraz Khan, PS43)
As an illustrative example of deploying modern statistical design and analytical methods to evaluate generative AI applications—ranging from patient-facing conversational agents to regulatory document authoring—Khan detailed a comprehensive framework combining embedding-based metrics with risk-stratified subject matter expert assessment7:
- The Embedding & SME Hybrid Framework:
- Embedding-Based Semantic Concordance: Instead of relying on word-matching heuristics, the system measures semantic vector distance using domain-adapted dense clinical sentence embeddings. This evaluates whether an AI output preserves the underlying biological, pharmacological, and statistical meaning of reference documents.
- Risk-Stratified Subject Matter Expert (SME) Assessment: Because semantic embeddings cannot detect critical directional or numerical errors (e.g., reversing an inequality sign in an interim stopping rule, misinterpreting an estimand attribute, or misclassifying an adverse event grade), expert evaluation is partitioned by regulatory risk. High-risk modules (primary efficacy summaries, safety contraindications, SAP derivation rules) undergo structured, multi-rater blinded review by senior biostatisticians and medical directors, while low-risk administrative sections receive automated validation with spot audits.
- Bayesian Hierarchical Modeling: Expert ratings on an ordinal Likert scale (
Yijk ∈ {1, …, c}for task i, rater j, and model k) are modeled via a Bayesian ordinal mixed-effects framework7:logit(P(Yijk ≤ c)) = αc − (μModel(k) + uTask(i) + vRater(j))where μModel represents the fixed performance effect of the AI system versus human experts, while random effects uTask(i) and vRater(j) account for task heterogeneity and inter-rater variability. - Non-Inferiority Testing and Power Calibration: Using simulation-based power analysis under the Bayesian hierarchical model, sponsors can formally test whether the generative device performs non-inferiorly to qualified human professionals within a pre-specified clinical margin δ7:
P(μAI − μHuman > −δ | Data) > 0.975This framework illustrates how modern biostatistical designs can quantify human-AI alignment and inter-rater reliability, satisfying regulatory demands for objective, reproducible performance validation of clinical AI tools.
Additional Information: Academic Exploratory Toolkits & Proofs-of-Concept (SC08)
Complementing agency pilots and enterprise industry rollouts, academic research groups are exploring methodological toolkits to adapt general-purpose language models into reproducible analytic tools3. In Short Course SC08, Yanxun Xu (Johns Hopkins University) presented technical methods to address foundational LLM limitations (hallucinations, non-determinism, and lack of provenance) in regulated biomedical research3:
                      ACADEMIC COMPLEMENTARY ARCHITECTURE
┌───────────────────────────────┐     ┌───────────────────────────────┐
│ 1. Retrieval-Augmented Gen    │     │ 2. Supervised Fine-Tuning     │
│ • Locked vector databases     │ ──▶ │ • Domain-specific task syntax │
│ • Citation provenance tracking│     │ • Biostatistical nomenclature │
└───────────────────────────────┘     └───────────────────────────────┘
                                                       │
                                                       ▼
                                      ┌───────────────────────────────┐
                                      │ 3. Structured-Output Schemas  │
                                      │ • Pydantic / Typed JSON output│
                                      │ • Automated self-correction   │
                                      └───────────────────────────────┘
- Retrieval-Augmented Generation (RAG): Evaluated as a mechanism to constrain generation to validated source chunks (e.g., historical trial protocols or SAPs) via semantic vector embeddings, ensuring claims maintain token-level citation trails back to source literature.
- Supervised Fine-Tuning (SFT): Fine-tuning model weights on specialized biomedical syntax and CDISC data structures to reduce semantic parsing errors in trial-specific terminology.
- Structured-Output Schema Enforcement: Constraining agent outputs to typed schemas (Pydantic / strict JSON), where programmatic compilers detect malformed parameter vectors and force an iterative, self-correcting generation loop.
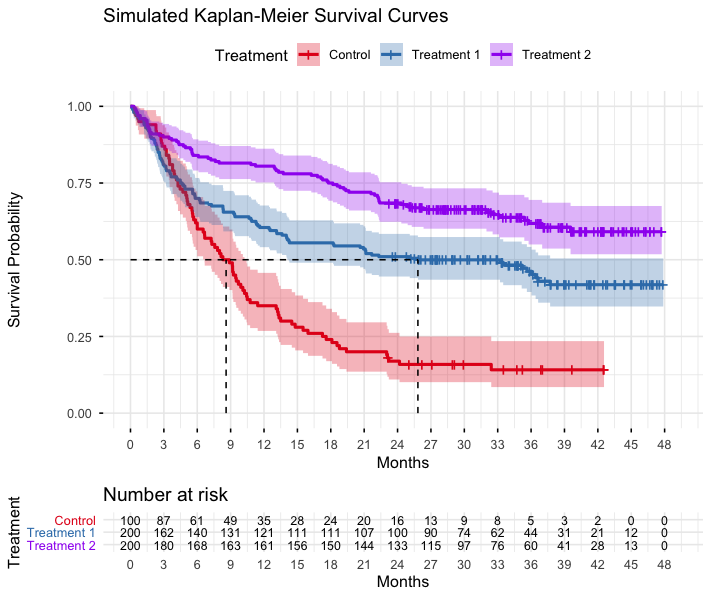
- Automated Individual Patient Data (IPD) Extraction: An academic proof-of-concept demonstrated linking computer vision models with the Guyot survival inversion algorithm19 to digitize published Kaplan-Meier raster curves:
Raster KM Image → [Vision Model] → Pixel Coordinates → [Guyot Algorithm] → Reconstructed IPDWhile this method illustrates how multimodal models can reconstruct event and censoring times from literature for comparative effectiveness or synthetic control design, regulatory acceptance remains conditional on rigorous cross-validation against original, auditable trial records.
3. Foundation Models and Causal Inference in Confirmatory RCTs
The Prediction vs. Inference Dilemma (SC01, PS43)
Biomedical foundation models (Ting Ye, Yanyao Yi) unify multimodal clinical realities—histopathology whole-slide images, continuous digital health tech (DHT) streams, electronic health records, and multi-omics—into dense latent vector representations1, 7.
                THE FOUNDATION MODEL DILEMMA IN REGULATORY INFERENCE
┌──────────────────────────────────────────────┐  ┌──────────────────────────────────────────────┐
│         MACHINE LEARNING OBJECTIVE           │  │            REGULATORY INFERENCE              │
│ • Maximize predictive power (min MSE, max AUC│  │ • Unbiased point estimation of effect        │
│ • High-dimensional, non-linear representation│  │ • Exact nominal Type I error control (α ≤ 5%)│
│ • Risk: Overfitting, black-box opacity       │  │ • Valid confidence intervals & coverage      │
└──────────────────────────────────────────────┘  └──────────────────────────────────────────────┘
                                       │                  │
                                       ▼                  ▼
                    ┌────────────────────────────────────────────────┐
                    │                   THE DANGER                   │
                    │ Directly substituting an AI model into primary │
                    │ confirmatory inference risks regulatory        │
                    │ rejection due to uncontrolled Type I error.    │
                    └────────────────────────────────────────────────┘
The Methodological Solution: AI-Assisted Covariate Adjustment (PS43)
To resolve this tension, Ting Ye (University of Washington) presented a framework that bridges complex foundation models with confirmatory inference, directly aligning with the FDA Guidance on Adjusting for Covariates in Randomized Clinical Trials (May 2023)12, 20:
                      AI-ASSISTED COVARIATE ADJUSTMENT

    Baseline Multimodal Inputs (X)               Post-Baseline Randomization
    ┌───────────────────────────────┐            ┌───────────────────────────────┐
    │ Histology Images (Embeddings) │            │ Active Treatment vs. Control  │
    │ Sensor Wearable Data Streams  │            │ Primary Clinical Outcome (Y)  │
    │ Multi-Omics Signatures        │            └───────────────────────────────┘
    └──────────────┬────────────────┘                            │
                   │                                             │
                   ▼                                             ▼
    ┌───────────────────────────────┐            ┌───────────────────────────────┐
    │   Multimodal Foundation AI    │            │ Covariate-Adjusted Estimator  │
    │  Generates Prognostic Score:  │ ─────────▶ │  • Semiparametric ANCOVA      │
    │        m̂(X) = Ê[Y | X]        │            │  • Type I error preserved     │
    │  (Uses baseline data ONLY)    │            │    even under misspecification│
    └───────────────────────────────┘            └───────────────────────────────┘
Mathematical Backbone
- The multimodal AI foundation model is restricted to baseline data only (Xi), generating a scalar prognostic score20:
m̂(Xi) = ΕFoundation AI[ Yi | Xi ]
- The prognostic score is entered into an Augmented Inverse Probability Weighted (AIPW) or semiparametric ANCOVA estimator for the Average Treatment Effect (θ)20–22:
θ̂ = (1/n) ∑i=1n [ ( Zi ( Yi − m̂(Xi) ) ) / e − ( (1 − Zi)( Yi − m̂(Xi) ) ) / (1 − e) ] + ( m̂1 − m̂0 )where Zi ∈ {0, 1} is randomized treatment assignment and
e = P(Zi = 1)is the randomization ratio.
Statistical and Regulatory Guarantees
- Strict Type I Error Invariance: Because physical randomization ensures treatment assignment is independent of baseline covariates (
Z ⊥ X), the estimator remains asymptotically normal and unbiased:√n (θ̂ − θ) →d N(0, σ²)This holds even if the multimodal AI foundation model is misspecified, biased, or overfitted20. The model cannot compromise Type I error control. - Proportional Variance Reduction & Sample Size Savings: When the AI model captures prognostic variation (R²AI > 0), the asymptotic variance shrinks proportionally20–22:
Var(θ̂) ≈ (1 − R²AI) · VarunadjA foundation model that achieves R²AI = 0.25 provides a 25% reduction in the required sample size (or a corresponding increase in power) within a fully compliant regulatory framework12, 20.
4. In Silico Trials, Digital Twins, and Federated Real-World Evidence
Virtual Representations in Clinical Development (PS41)
Session PS41 (Wen Li, Elena Sizikova [FDA], Bo Huang, Yong Chen) surveyed emerging concepts and showcased industry and academic applications for virtual biological representations6, 23, 24:
┌─────────────────────────┐   ┌─────────────────────────┐   ┌─────────────────────────┐
│      DIGITAL TWINS      │   │    IN SILICO TRIALS     │   │     SYNTHETIC DATA      │
├─────────────────────────┤   ├─────────────────────────┤   ├─────────────────────────┤
│ • Dynamic, mechanistic  │   │ • Full computer-simula- │   │ • Generative diffusion  │
│   patient models        │   │   ted trial populations │   │   or Bayesian networks  │
│ • Continuously updated  │   │ • Tests PK/PD and       │   │ • Supplements small     │
│   with live biomarkers  │   │   dosing in virtual cohorts│ │  datasets(rare disease)│
│ • Forecasts progression │   │ • Bypasses human trial  │   │ • Preserves patient     │
│   (e.g., ADAS-Cog decline)│ │   exposure when unneeded│   │   privacy & covariance  │
└─────────────────────────┘   └─────────────────────────┘   └─────────────────────────┘
In Silico Control Cohorts in Organ Impairment: Innovative Computational Frameworks (Bo Huang, Pfizer, PS41)
Dedicated Phase 1 studies in patients with renal or hepatic impairment evaluate drug clearance against matched healthy controls6. Enrolling healthy participants consumes operational resources and exposes healthy volunteers to investigational agents without therapeutic benefit.
- Innovative Methodology: Pfizer showcased an innovative computational proof-of-concept generating virtual healthy cohorts from historical Phase 1 clinical databases using physiologically-based pharmacokinetic (PBPK) and statistical matching models6. This innovative strategy illustrates how computational biology can minimize unnecessary clinical exposure in healthy participants while streamlining development timelines.
- Evolving Regulatory Landscape: Health authorities are actively developing policy and review frameworks to evaluate Digital Health (DH) technologies and AI in clinical research13, 14, 25. Major initiatives—including the FDA Digital Health Center of Excellence (DHCoE), European Medicines Agency (EMA) guidance, the Avicenna Alliance, and the EU Artificial Intelligence Act (2024)—reflect growing regulatory interest in modeling and simulation15, 25, 26. Under ICH M15 (Step 4), deploying in silico cohorts as formal comparative benchmarks requires establishing model credibility, validating data provenance, and engaging regulatory review divisions early through fit-for-purpose Context of Use (CoU) agreements16.
The "XYZ" Unified Framework for Real-World Data: An Innovative Use Case and Evolving Regulatory Thinkings (Yong Chen, UPenn, PS41)
Yong Chen introduced the XYZ Framework as an innovative use case to advance clinical evidence generation by jointly modeling three core dimensions: Treatment (X), Outcome (Y), and Population (Z)6, 27:
                            THE "XYZ" RWD ARCHITECTURE
┌───────────────────────────┐     ┌───────────────────────────┐     ┌───────────────────────────┐
│     POPULATION (Z)        │     │       TREATMENT (X)       │     │        OUTCOME (Y)        │
│ Lossless Federated Target │ ──▶ │ Causal Trees & High-Dim   │ ──▶ │ Negative-Control Exposure │
│ Trial Emulation           │     │ Propensity Adjustment     │     │ & Outcome Calibration     │
│ (Zero patient-level share)│     │ Counterfactual eligibility│     │ Removes unmeasured bias   │
└───────────────────────────┘     └───────────────────────────┘     └───────────────────────────┘
- Population Dimension (Z) — Lossless Federated Emulation: Runs target trial emulation across distributed healthcare systems without centralizing protected health information (PHI)6, 27. Lossless federated algorithms aggregate local likelihood gradients, producing global parameter estimates identical to pooled patient-level data.
- Treatment Dimension (X) — Counterfactual Eligibility Optimization: Deploys AI-guided counterfactual simulation to evaluate alternative inclusion and exclusion criteria across real-world cohorts, optimizing trial generalizability and enrollment feasibility.
- Outcome Dimension (Y) — Negative-Control Debiasing: Adjusts for unmeasured confounding by evaluating negative control outcomes (endpoints biologically unaffected by the drug) and negative control exposures, empirically calibrating the primary treatment effect estimate.
Applications: Demonstrated in repurposing GLP-1 receptor agonists, identifying treatments for Alzheimer's disease, and designing trials in advanced non-small cell lung cancer (NSCLC)6.
Evolving Regulatory Thinkings (Intersecting with the Estimand Framework): As innovative RWD frameworks like XYZ continue to mature, they stimulate valuable thinking on how machine-learning pipelines can integrate with global regulatory standards. In particular, evolving these methodologies to incorporate the ICH E9(R1) estimand framework18—explicitly pre-specifying strategies for handling Intercurrent Events (ICEs) such as treatment switching, discontinuations, or competing risks in longitudinal real-world data—represents a vital avenue to ensure observational treatment effects translate into interpretable parameters for regulatory drug labeling.
5. AI-Assisted Adaptive Trial Designs and Agent Hubs
Covariate-Adaptive and Response-Adaptive Randomization: AI-Assisted Adaptive Designs Short Course (SC04)
Delivered as a specialized short course at RISW 2026, Feifang Hu (George Washington University) and Will Ma (HopeAI) presented a comprehensive scientific framework for advancing randomization through AI-assisted adaptive clinical trial design toolkits2:
- AI-Assisted Design Toolkits: Modern adaptive architectures leverage emerging AI tools—such as AI agent hubs for automated evidence synthesis, multi-variable baseline covariate selection, and synthetic IPD generators (
SynthIPD)—to streamline trial design and execute large-scale simulation studies that make complex adaptive designs operationally practical2. - Covariate-Adaptive Randomization (CAR): Dynamically balances multi-dimensional discrete and continuous baseline covariates across treatment arms via Pocock-Simon minimization or Mahalanobis distance scoring, overcoming the stratum fragmentation that occurs with traditional permuted block randomization2, 28.
- Covariate-Adjusted Response-Adaptive Randomization (CARA) & Methodological Considerations: CARA progressively skews patient allocation probabilities toward superior arms based on accumulating intermediate patient responses and baseline biomarker profiles (Xi), aligning ethical patient allocation with trial efficiency2, 28. While highly promising, utilizing CARA invites thoughtful scientific consideration—particularly when evaluated for potential application in confirmatory settings:
- Trial Integrity & Blinding Safeguards: Because CARA requires unblinded, accumulating patient outcome data to continuously update allocation probabilities, trials require rigorous operational separation and strict logistical firewalls to prevent investigator anticipation of treatment assignments and preserve trial integrity28, 29.
- Temporal Trends & Population Drift: When allocation ratios shift over calendar time in the presence of secular trends (e.g., changes in standard-of-care, patient referral patterns, or seasonal variations), time and treatment become correlated, requiring careful modeling to avoid estimation bias28, 29.
- The Inferential Rule (Covariate-Adjusted Testing): Both CAR and CARA induce correlation across treatment assignments28–31. Conventional unadjusted hypothesis tests (standard t-test or log-rank test) become conservative, resulting in deflated test statistics and loss of statistical power30, 31. To preserve nominal Type I error and realize the efficiency gains of the design, the analysis plan must pre-specify an associated covariate-adjusted analysis framework (e.g., robust linear modeling with empirical sandwich variance)12, 30, 31.
AI Agent Hubs in Early-Phase Optimization: Advantages, Results, and Parameter Risks (Plenary 1, SC04, PS37)
In early clinical development (e.g., Phase 1 oncology dose optimization under FDA's Project Optimus), identifying the Optimal Biologic Dose (OBD) requires evaluating multi-cycle utility surfaces10, 32:
- Advantages and Results: Specialized LLM agent hubs (Dacheng Liu, Boehringer-Ingelheim) ingest preclinical toxicity data and trial objectives to autonomously simulate, compare, and optimize Bayesian Optimal Interval (BOIN) and Continual Reassessment Method (CRM) variations10. These systems enable multi-dimensional parameter search, identifying dosing strategies that balance acute CTCAE Grade ≥ 3 toxicities with chronic, low-grade functional interference (PRO-CTCAE)10, 32.
- Potential Risks of AI Agent Hubs:
- Overfitting to Narrow Simulation Assumptions: Agentic networks can converge on design parameters that are locally optimal for a specific simulated data-generating distribution but catastrophically brittle if real-world patient enrollment or toxicity kinetics drift33, 34.
- Black-Box Opacity & Loss of Auditability: Automated prompt-and-code loops can mask parameter sensitivities, leaving clinical teams unable to justify specific interim stopping boundaries to regulatory reviewers (FDA Project Optimus; Liu et al., RISW 2026)10, 32.
The Bridge to Draft ICH E20: Clinical Trial Simulation as Formal Regulatory Evidence (PS37)
The rapid proliferation of complex algorithmic designs, AI agent hubs, and Bayesian adaptive mechanisms has forced global health authorities to establish harmonized evidentiary standards17, 33. In response, the International Council for Harmonisation released the draft guideline ICH E20 (Adaptive Designs for Clinical Trials)17.
ICH E20 establishes that for complex adaptive designs—where closed-form analytical derivations of operating characteristics are mathematically intractable—clinical trial simulation studies are elevated from supportive internal planning exercises to formal, reviewable regulatory submissions9, 17.
                     ICH E20 SIMULATION-TO-SUBMISSION PIPELINE
┌───────────────────────────────┐     ┌───────────────────────────────┐     ┌───────────────────────────────┐
│ Prospective Simulation Plan   │     │ High-Performance Sim Battery  │     │ Regulatory Submission Dossier │
│ • Multi-dimensional parameter │ ──▶ │ • ≥100,000 runs per scenario  │ ──▶ │ • Containerized code (R/Py)   │
│   nuisance grids              │     │ • Comprehensive Type I &      │     │ • Random seed audit logs      │
│ • Candidate estimands (E9(R1))│     │   power boundary mapping      │     │ • Trial trajectory profiles   │
└───────────────────────────────┘     └───────────────────────────────┘     └───────────────────────────────┘
                                                       │
                                                       ▼
                                      ┌───────────────────────────────┐
                                      │ Logistical Firewall Protocols │
                                      │ • Data Access Plans (DAP)     │
                                      │ • Independent Statistical Ctr │
                                      │ • Unblinded IDMC boundaries   │
                                      └───────────────────────────────┘
1. Core Draft ICH E20 Guideline Principles & Regulatory Thinkings
- Prospective Planning & Pre-Specification (Section 4.1): All adaptation rules (interim stopping boundaries, sample size re-estimation, arm-dropping rules) must be prospectively codified in the protocol and SAP prior to enrollment; unblinded post-hoc adjustments invalidate Type I error claims17.
- Type I Error Control Across Parameter Spaces (Section 4.2): Error control cannot be demonstrated solely at a single favored design point; it must hold across a broad grid of nuisance parameters (e.g., control event drift, accrual kinetics, endpoint variances)17.
- The Simulation Dossier Standard (Section 5.2): For confirmatory designs, simulations require ≥ 100,000 iterations per scenario to estimate Type I error within ± 0.1% precision, accompanied by executable containerized code (R/Python), documented RNG seeds, and sample trajectories17.
- Trial Integrity & Data Access Plans (Section 5.4): Unblinded interim comparative data must remain restricted to an Independent Data Monitoring Committee (IDMC) and independent statistical center under a strict Data Access Plan (DAP) to prevent operational bias17, 35.
- Estimand Alignment & Estimation Bias (Section 5.1 & ICH E9(R1)): Adaptive population or arm changes must be pre-specified as estimand selection rules, and protocols must incorporate adjusted estimators to correct for post-adaptation selection and stopping bias17, 18, 35.
                       DRAFT ICH E20 REGULATORY REQUIREMENTS
┌─────────────────────────────────────────────────────────────────────────────┐
│ 1. Fine-Grid Parameter Exploration: Nuisance parameters must be evaluated   │
│    across comprehensive grids to detect non-linear error inflation ridges.  │
├─────────────────────────────────────────────────────────────────────────────┤
│ 2. Large-Scale Iterations: Confirmatory adaptive designs require            │
│    ≥100,000 simulated trials per scenario to estimate Type I error control  │
│    within ±0.1% precision.                                                  │
├─────────────────────────────────────────────────────────────────────────────┤
│ 3. Reproducible Containerized Dossiers: Executable simulation code(R/Python)│
│    with documented RNG seeds and sample trial trajectories must accompany   │
│    the Statistical Analysis Plan (SAP).                                     │
└─────────────────────────────────────────────────────────────────────────────┘
2. Real-World Use Cases from RISW 2026 (PS37, SC04, Plenary 1)
- Platform Trial Design in Tuberculosis—The Process of Iterative Convergence (Tobias Mielke, Janssen Cilag GmbH, PS37): Designing an efficient confirmatory platform trial in tuberculosis (TB) presented substantial hurdles: historical standard-of-care event rates were poorly characterized across geographic regions, true treatment effect sizes were unknown, and patient recruitment dynamics fluctuated widely9. Rather than attempting to calculate an optimal design upfront, the team utilized a high-level Target Product Profile (TPP) to establish a pragmatic baseline, subsequently deploying massive Monte Carlo simulations as an interactive communication and decision-making engine9, 36. Early simulation runs exposed inadequate power and excessive trial duration under plausible biological shifts9. Successive simulation cycles refined interim monitoring rules, allocation strategies, and continuous longitudinal progression modeling9. Defensibility was grounded in the process of convergence, turning simulation into an iterative governance vehicle accepted by regulatory review divisions9.
- Blinded Mid-Flight Redesign Leading to FDA Approval (Nicholas Berry, Berry Consultants, PS37): During an ongoing confirmatory trial, accumulating external evidence indicated that the initial trial design was suboptimal9. Because the sponsor could not alter the trial based on unblinded data, Berry Consultants constructed an adaptive redesign developed entirely on simulated models while trial teams remained strictly blinded9. The redesign incorporated three prospectively defined interim analyses evaluating predictive probabilities of success (PPoS), early stopping for efficacy/futility, and a formal multiple imputation (MI) framework to model early dropouts9, 33. Because analytical distributions were intractable, the sponsor mapped rejection probabilities across tens of thousands of scenarios encompassing diverse null and drift conditions9. FDA review divisions evaluated the simulation dossier, confirmed Type I error preservation, and formally granted marketing approval upon concordant primary trial readout9.
- The Regulator's Perspective on Simulation as the "Universal Translator" (Lisa Rodriguez, GSK, PS37): Drawing on experience as a former FDA regulatory reviewer, Dr. Rodriguez highlighted that clinical medical officers and division directors evaluate trials through the lens of patient safety, operational feasibility, and clinical interpretable value9. Presenting individual simulated trial trajectories makes abstract algorithmic rules tangible9. Furthermore, well-planned simulation dossiers pre-empt Information Requests (IRs) by providing pre-calculated operating characteristics across operational stress scenarios (e.g., enrollment dropping by 50% or dropouts doubling)9.
- AI Agent Hubs vs. ICH E20 Rigor (Dacheng Liu, Boehringer Ingelheim; Heng Zhou, BMS): While autonomous LLM agent hubs accelerate multi-cycle dose optimization under Project Optimus, they risk converging on designs that are locally optimal for narrow simulation parameters but brittle under real-world clinical drift10. Draft ICH E20 bridges this vulnerability by requiring that agent-optimized designs be independently audited across broad, non-adaptive parameter spaces17.
6. Methodological Risks, Traps, and the Quantitative Competency Roadmap
Methodological Traps and Failure Modes
                         THREE CRITICAL AI METHODOLOGICAL TRAPS
┌───────────────────────────────┐     ┌───────────────────────────────┐     ┌───────────────────────────────┐
│ 1. Inferential Incoherence    │     │ 2. Unadjusted CAR/CARA Tests  │     │ 3. The "Anchor Illusion"      │
│ • Inserting IPW weights into  │     │ • Using standard unadjusted   │     │ • Evaluating composed adaptive│
│   standard Bayesian likelihood│     │   tests after dynamic alloc.  │     │   rules at one parameter point│
│ • Ignores weight variance     │     │ • Induces correlation, causes │     │ • Feedback loops trigger      │
│ • Compressed posterior,       │     │   conservative test stats &   │     │   severe Type I error spikes  │
│   severe Type I error spike   │     │   substantial power loss      │     │   along composite null ridges │
└───────────────────────────────┘     └───────────────────────────────┘     └───────────────────────────────┘
- Inferential Incoherence in External Borrowing: Applying frequentist propensity weights inside a standard Bayesian likelihood without adjusting the posterior variance leads to artificially narrow credible intervals and uncontrolled false-positive rates. Generative Bayesian G-computation (e.g., BART) or asymptotic curvature adjustments (
R = AB-1A) are required. - Conservative Bias in Adaptive Randomization: Applying unadjusted log-rank or t-tests to data generated under Covariate-Adaptive Randomization causes power loss30, 31. The analysis plan must pre-specify covariate-adjusted models12.
- The "Anchor Illusion" in Composed Designs: Calibrating operating characteristics solely at a single design point can conceal error inflation along composite null boundaries when multiple adaptive mechanisms (prior drag, response-adaptive allocation, sample size re-estimation) interact dynamically17.
Professional Roadmap: Four AI Competencies for Biostatisticians as a Grounded Example (PS49)
As a raised example delivering scientific and rigorous groundings for professional growth in the algorithmic era, Haoda Fu (Amgen) outlined four core competencies quantitative scientists must develop to lead drug development8:
                             THE 4 AI COMPETENCIES
┌───────────────────────────────┐               ┌───────────────────────────────┐
│         1. AI MINDSET         │               │       2. AI COMMUNICATION     │
│ Move from static programming  │               │ Translate complex foundation  │
│ to probabilistic systems and  │               │ models into clinical and      │
│ agentic reasoning frameworks  │               │ regulatory decision language  │
└──────────────┬────────────────┘               └───────────────┬───────────────┘
               │                                                │
               └───────────────────────┬────────────────────────┘
                                       │
                                       ▼
┌───────────────────────────────┐               ┌───────────────────────────────┐
│        3. AI INTEGRATION      │               │     4. AI-ENABLED INNOVATION  │
│ Anchor AI within semiparamet- │               │ Design novel adaptive systems,│
│ ric causal inference to safely│               │ digital twins, and in silico  │
│ harvest efficiency gains      │               │ workflows under ICH M15 / E20 │
└───────────────────────────────┘               └───────────────────────────────┘
- AI Mindsets: Evolving from deterministic coding routines toward probabilistic systems, context engineering, and multi-agent supervisory architectures8.
- AI Communication: Translating high-dimensional computational outputs into clear clinical and regulatory language, connecting complex model readouts to formal ICH E9(R1) estimands8, 18.
- AI Integration: Grounding machine learning tools within causal inference frameworks (e.g., semiparametric ANCOVA, target trial emulation) to gain statistical power while guaranteeing Type I error control8, 20, 27.
- AI-Enabled Innovation: Spearheading the deployment of in silico trials, synthetic cohorts, and simulation-guided adaptive systems under ICH M15 and ICH E20 standards8, 16, 17.
7. Strategic Synthesis: Framework Mapping Across Development Phases
The following matrix connects drug development phases with emerging AI methodologies, primary inferential risks, and corresponding regulatory guidelines:
| Development Phase | AI / Computational Methodology | Primary Inferential Risk | Regulatory Guardrail & Guideline |
|---|---|---|---|
| Discovery & Preclinical | Generative molecular design, predictive QSAR, multimodal omics embeddings1. | Lack of biological generalizability; false target signal. | Standard preclinical assay validation; FDA Discussion Paper on AI/ML11. |
| Phase 1 Dose Optimization | DOD-PRO-BART, Agentic Design Hubs (BOIN vs. CRM simulation)10, 32. | Over-escalation based solely on acute DLTs while ignoring chronic tolerability. | FDA Project Optimus: Multi-cycle PRO-CTCAE tolerability modeling32. |
| Specialized Phase 1 (Organ Impairment) | In Silico Virtual Control Cohorts (historical Phase 1 matching)6. | Mechanistic PBPK model misspecification; evolving regulatory consensus on replacing control cohorts. | ICH M15 (Step 4)16 & FDA CDRH Computational Modeling Guidance14. |
| Confirmatory Phase 2/3 RCTs | Semiparametric ANCOVA with Multimodal Foundation AI Prognostic Scores7, 20. | Model misspecification causing Type I error inflation or bias. | FDA Covariate Adjustment Guidance (2023)12: Strict error invariance via baseline adjustment. |
| Adaptive Phase 2/3 Trials | Covariate-Adaptive (CAR) & Response-Adaptive (CARA) Randomization2, 28. | Correlation across patient allocations; depressed power under unadjusted tests; operational integrity risks under CARA. | Draft ICH E2017: Pre-specified covariate-adjusted test statistics & ≥ 100k simulation grids. |
| Rare Disease / External Controls | Digital Twins, SynthIPD, Lossless Federated Target Trial Emulation (XYZ)2, 6, 27. |
"Inferential Incoherence," immortal time bias, missing ICH E9(R1) ICE strategies18. | EMA Reflection Paper on Single-Arm Trials26; ICH M15 Model Analysis Plan (MAP)16. |
| Regulatory Filing & Dossier Review | Agentic Review Systems (FDA internal pilot), Schema-Locked LLM RAG pipelines3, 5. | Ungrounded hallucinations, non-determinism, cross-module CSR discrepancies. | FDA Agentic Review Standards5; Bayesian Ordinal Mixed-Effects Non-Inferiority Testing7. |
| Post-Market Surveillance | Prompt-engineered LLM synopses for FDA Sentinel ARIA system7. | Inappropriate query formulation in active surveillance. | FDA Sentinel System Validation Protocols7. |
The modern regulatory consensus establishes that artificial intelligence cannot operate as an unverified "black box" in therapeutic decision-making. By anchoring generative agents, foundation models, and in silico systems within formal causal inference frameworks, pre-specified Model Analysis Plans, and rigorous simulation suites, quantitative scientists can deploy AI to accelerate clinical development while maintaining statistical rigor and protecting public health.
References
- Ye, T., & Yi, Y. (2026). Biomedical AI Foundation Models and Applications in Drug Development. Short Course SC01, Regulatory-Industry Statistics Workshop (RISW 2026).
- Hu, F., & Ma, W. (2026). AI-Powered Adaptive Designs: Bringing Innovative Clinical Trial Designs into Practice. Short Course SC04, Regulatory-Industry Statistics Workshop (RISW 2026).
- Xu, Y. (2026). Adapting Generative AI for Biomedical Research and Drug Development. Short Course SC08, Regulatory-Industry Statistics Workshop (RISW 2026).
- Mielke, T., Tegenge, M., Margolskee, A., & Best, N. (2026). Assumptions, Modelling and Risks: Utilization of ICH-M15 beyond MIDD. Parallel Session PS07, Regulatory-Industry Statistics Workshop (RISW 2026).
- Carlin, B., Rochon, J., Xu, Y., & Thompson, L. (2026). Agentic AI in US Regulatory Science: Current Methodological Developments and Early Guidance for Sponsors. Parallel Session PS04, Regulatory-Industry Statistics Workshop (RISW 2026).
- Li, W., Huang, B., Sizikova, E., & Chen, Y. (2026). Revolutionizing Clinical Trials with Digital Twins, In Silico control, RWD, or Synthetic Patient Data. Parallel Session PS41, Regulatory-Industry Statistics Workshop (RISW 2026).
- Ye, T., Yi, Y., Jones, J., & Khan, S. (2026). From FDA Draft Guidance to Practice: Credible and Fit-for-Purpose AI in Clinical Drug Development and Post-Market Surveillance. Parallel Session PS43, Regulatory-Industry Statistics Workshop (RISW 2026).
- Acosta, R., Liu, J., Grambow, S., Pennello, G., & Fu, H. (2026). Agentic AI and LLMs for Biostatisticians: Pros and Cons of an Emerging Technology in a Transdisciplinary Field. Parallel Session PS49, Regulatory-Industry Statistics Workshop (RISW 2026).
- Meyer, E. L., Overbey, J., Mielke, T., Berry, N., & Rodriguez, L. (2026). Design, Simulate, Refine: Simulation-Guided Clinical Trial Design in the Age of ICH E20. Parallel Session PS37, Regulatory-Industry Statistics Workshop (RISW 2026).
- Gomatam, S., Hong, H., & Liu, D. (2026). Collaborative Innovation in a Rapidly Transforming Digital World. Plenary Session 1, Regulatory-Industry Statistics Workshop (RISW 2026).
- US Food and Drug Administration (FDA). (2023). Using Artificial Intelligence and Machine Learning in the Development of Drug and Biological Products. Discussion Paper and Request for Feedback, CDER/CBER/CDRH.
- US Food and Drug Administration (FDA). (2023). Adjusting for Covariates in Randomized Clinical Trials for Drugs and Biological Products. Guidance for Industry, CDER/CBER.
- US Food and Drug Administration (FDA). (2024). Digital Health Center of Excellence (DHCoE) Strategic Priorities and Regulatory Science Framework. FDA CDRH.
- US Food and Drug Administration (FDA). (2023). Assessing the Credibility of Computational Modeling and Simulation in Medical Device Submissions. Final Guidance for Industry and FDA Staff, Docket FDA-2021-D-0980.
- European Medicines Agency (EMA). (2023). Reflection Paper on the Use of Artificial Intelligence in the Lifecycle of Medicinal Products. EMA/CHMP/CVMP/83833/2023.
- International Council for Harmonisation (ICH). (2024/2026). ICH M15: General Principles for Model-Informed Drug Development. Step 4 Final Guideline.
- International Council for Harmonisation (ICH). (2025/2026). ICH E20: Adaptive Designs for Clinical Trials. Draft Guideline, Step 2b/3.
- International Council for Harmonisation (ICH). (2019). ICH E9(R1): Addendum on Estimands and Sensitivity Analysis in Clinical Trials to the Guideline on Statistical Principles for Clinical Trials. Step 4 Final Guideline.
- Guyot, P., Ades, A. E., Ouwens, M. J., & Welton, N. J. (2012). Enhanced secondary analysis of survival data: reconstructing the data from published Kaplan-Meier survival curves. BMC Medical Research Methodology, 12(1), 9.
- Ye, T., Shao, J., & Yi, Y. (2023). Causal inference in randomized trials with high-dimensional multimodal predictions: Semiparametric efficiency and robustness. Journal of the American Statistical Association, 118(544), 2725–2737.
- Yang, L., & Tsiatis, A. A. (2001). Efficiency study of estimators for a treatment effect in a pretest-posttest trial. The American Statistician, 55(4), 314–321.
- Tsiatis, A. A., Davidian, M., Zhang, M., & Lu, X. (2008). Covariate adjustment for two-sample treatment comparisons in randomized clinical trials: A tutorial. Statistics in Medicine, 27(12), 2064–2085.
- Sizemore, N., Oliphant, K., Zheng, R., Martin, C. R., Claud, E. C., & Chattopadhyay, I. (2024). A digital twin of the infant microbiome to predict neurodevelopmental deficits. Science Advances, 10(14), eadj0400.
- Bertolini, D., Loukianov, A. D., Smith, A., et al. (2021). Forecasting progression of mild cognitive impairment (MCI) and Alzheimer's disease (AD) with digital twins. Alzheimer's & Dementia, 17(Suppl 9), e054414.
- Avicenna Alliance & Virtual Physiological Human Institute. (2024). In Silico Clinical Trials: How Computer Simulation is Transforming Medical Product Development. Policy Roadmap.
- European Medicines Agency (EMA). (2024). Reflection Paper on Single-Arm Trials as Pivotal Evidence for Marketing Authorisation Applications. EMA/CHMP/564493/2021.
- Hernán, M. A., & Robins, J. M. (2020). Causal Inference: What If. Boca Raton: Chapman & Hall/CRC.
- Hu, F., & Rosenberger, W. F. (2006). The Theory of Response-Adaptive Randomization in Clinical Trials. Hoboken: John Wiley & Sons.
- Rosenberger, W. F., & Lachin, J. M. (2015). Randomization in Clinical Trials: Theory and Practice (2nd ed.). Hoboken: John Wiley & Sons.
- Shao, J., Yu, X., & Zhong, B. (2010). A theory for testing hypotheses after covariate-adaptive randomization. Biometrika, 97(2), 347–360.
- Ma, W., Hu, F., & Zhang, L. X. (2015). Testing hypotheses of covariate-adaptive randomized clinical trials. Journal of the American Statistical Association, 110(510), 669–680.
- US Food and Drug Administration (FDA) Oncology Center of Excellence. (2023). Project Optimus: Reforming Dose Optimization and Dose Selection in Oncology Drug Development. Guidance Framework.
- Berry, S. M., Carlin, B. P., Lee, J. J., & Müller, P. (2010). Bayesian Adaptive Methods for Clinical Trials. Boca Raton: Chapman & Hall/CRC Biostatistics Series.
- Gelman, A., Carlin, J. B., Stern, H. S., Dunson, D. B., Vehtari, A., & Rubin, D. B. (2013). Bayesian Data Analysis (3rd ed.). Boca Raton: Chapman & Hall/CRC.
- Bauer, P., Bretz, F., Dragalin, V., König, F., & Wassmer, G. (2016). Twenty-five years of confirmatory adaptive designs: opportunities and pitfalls. Statistics in Medicine, 35(3), 325–347.
- Meyer, E. L., Mesenbrink, P., Mielke, T., et al. (2021/2024). The evolution of platform trials in clinical development: A simulation-guided perspective. Biometrical Journal, 63(2), 271–289.